Portfolio Details
Power BI Dashboard: Incoming Overview for Logistics
This Power BI dashboard is designed to provide a comprehensive overview of incoming logistics operations, focusing on orderliness, vendor performance, and return management. The dashboard is divided into three main pages, each offering detailed insights into different aspects of the logistics process.
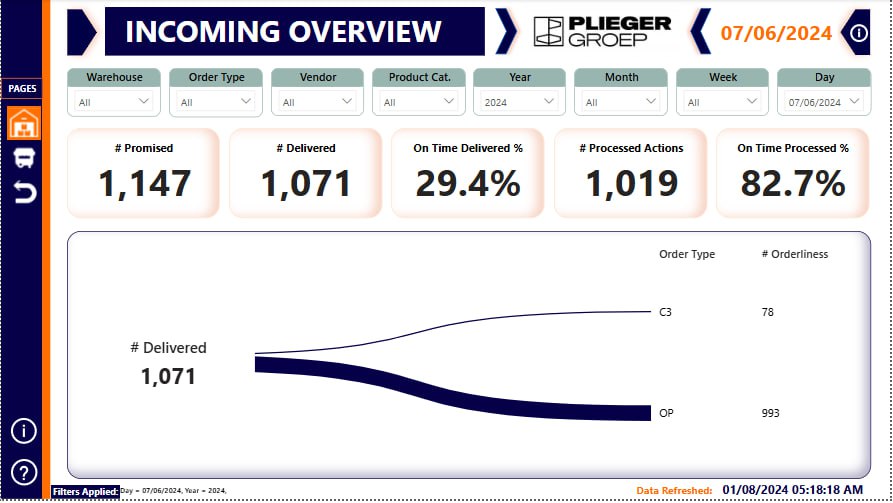
1. Incoming Overview Page
The Incoming Overview page serves as the primary interface for monitoring daily logistics performance. It includes the following key metrics:
- Promised: The total number of orders promised by vendors and returns for the day. It sets the benchmark for expected deliveries and processing.
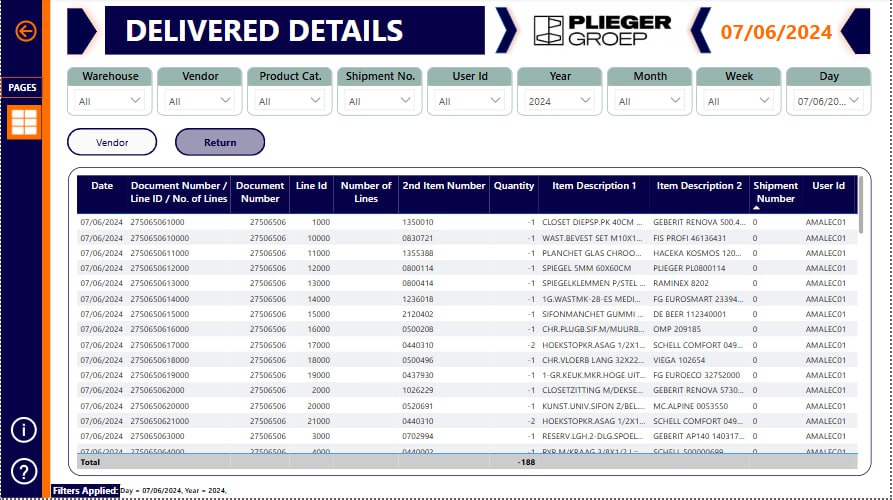
- Delivered: The total number of orders actually delivered, combining both vendor and return orders. It helps in assessing the fulfillment rate.
- Processed: The total number of orders processed, including both vendor and return orders. Processing involves sorting, quality checks, and preparation for delivery.
- On Time Delivered %: This percentage reflects the efficiency of the delivery process, calculated as (Total On Time Delivered ÷ Total Delivered) * 100%.
- On Time Processed %: This metric measures the timeliness of order processing, calculated as (Total On Time Processed ÷ Total Processed) * 100%.
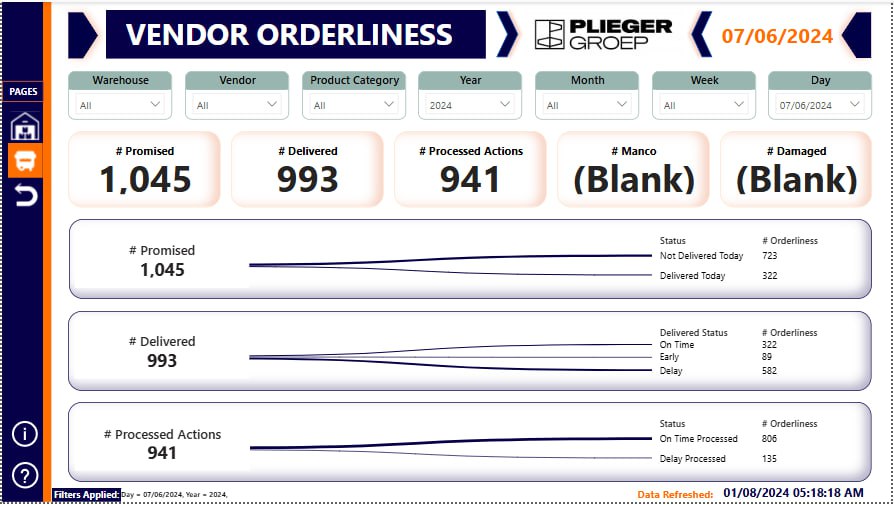
2. Vendor Page
The Vendor page focuses on the performance of vendors in terms of order fulfillment and quality. Key metrics include:
- Promised: The total number of orders promised by vendors for the day.
- Delivered: The actual number of orders delivered by vendors, providing insight into their reliability.
- Processed: The number of vendor orders that have been processed.
- Manco: Orders redirected to manual handling centers due to incomplete information or special handling requirements.
- Damaged: The number of vendor orders that arrived damaged, crucial for assessing goods quality.
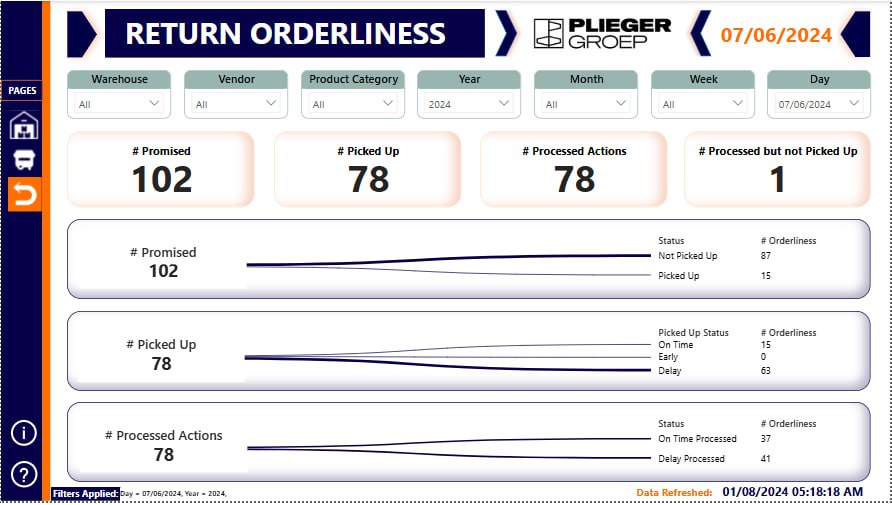
3. Return Page
The Return page is dedicated to managing and analyzing return orders. It includes the following metrics:
- Promised: The total number of return orders promised for processing on the day.
- Picked: The actual number of return orders picked up or received.
- Processed: The number of return orders that have been processed.
- Processed but not Delivered: Tracks return orders that were processed but not delivered back to the customer due to defects or other issues.
Dashboard Features
- Dynamic Date Filtering: Filter data by year, month, week, and specific days for trend analysis.
- Interactive Visuals: Use of interactive charts and graphs for detailed analysis.
- Real-Time Data Refresh: Ensuring current and accurate insights.
Impact and Benefits
- Enhanced Decision-Making: Provides a clear overview of logistics operations for informed decisions.
- Improved Efficiency: Identifies bottlenecks and areas for improvement in logistics.
- Vendor Performance Monitoring: Tracks vendor performance to ensure accountability and service quality.
- Customer Satisfaction: Efficient handling of returns and timely processing of orders for a better customer experience.
This Power BI dashboard is a powerful tool for logistics management, offering actionable insights that drive operational efficiency and improve overall performance.